



















INSIDE WITH
A VIEW
Regression analysis makes it possible to quantify the influence of various economic indicators such as interest rates, inflation rates and money supply on digital assets.

REGRESSION analyses!
Regression analysis identifies and quantifies market trends and anomalies that might otherwise be overlooked.
One step ahead of the market!
Our regression analyses allow us to assess the markets we trade in a different or more in-depth way.
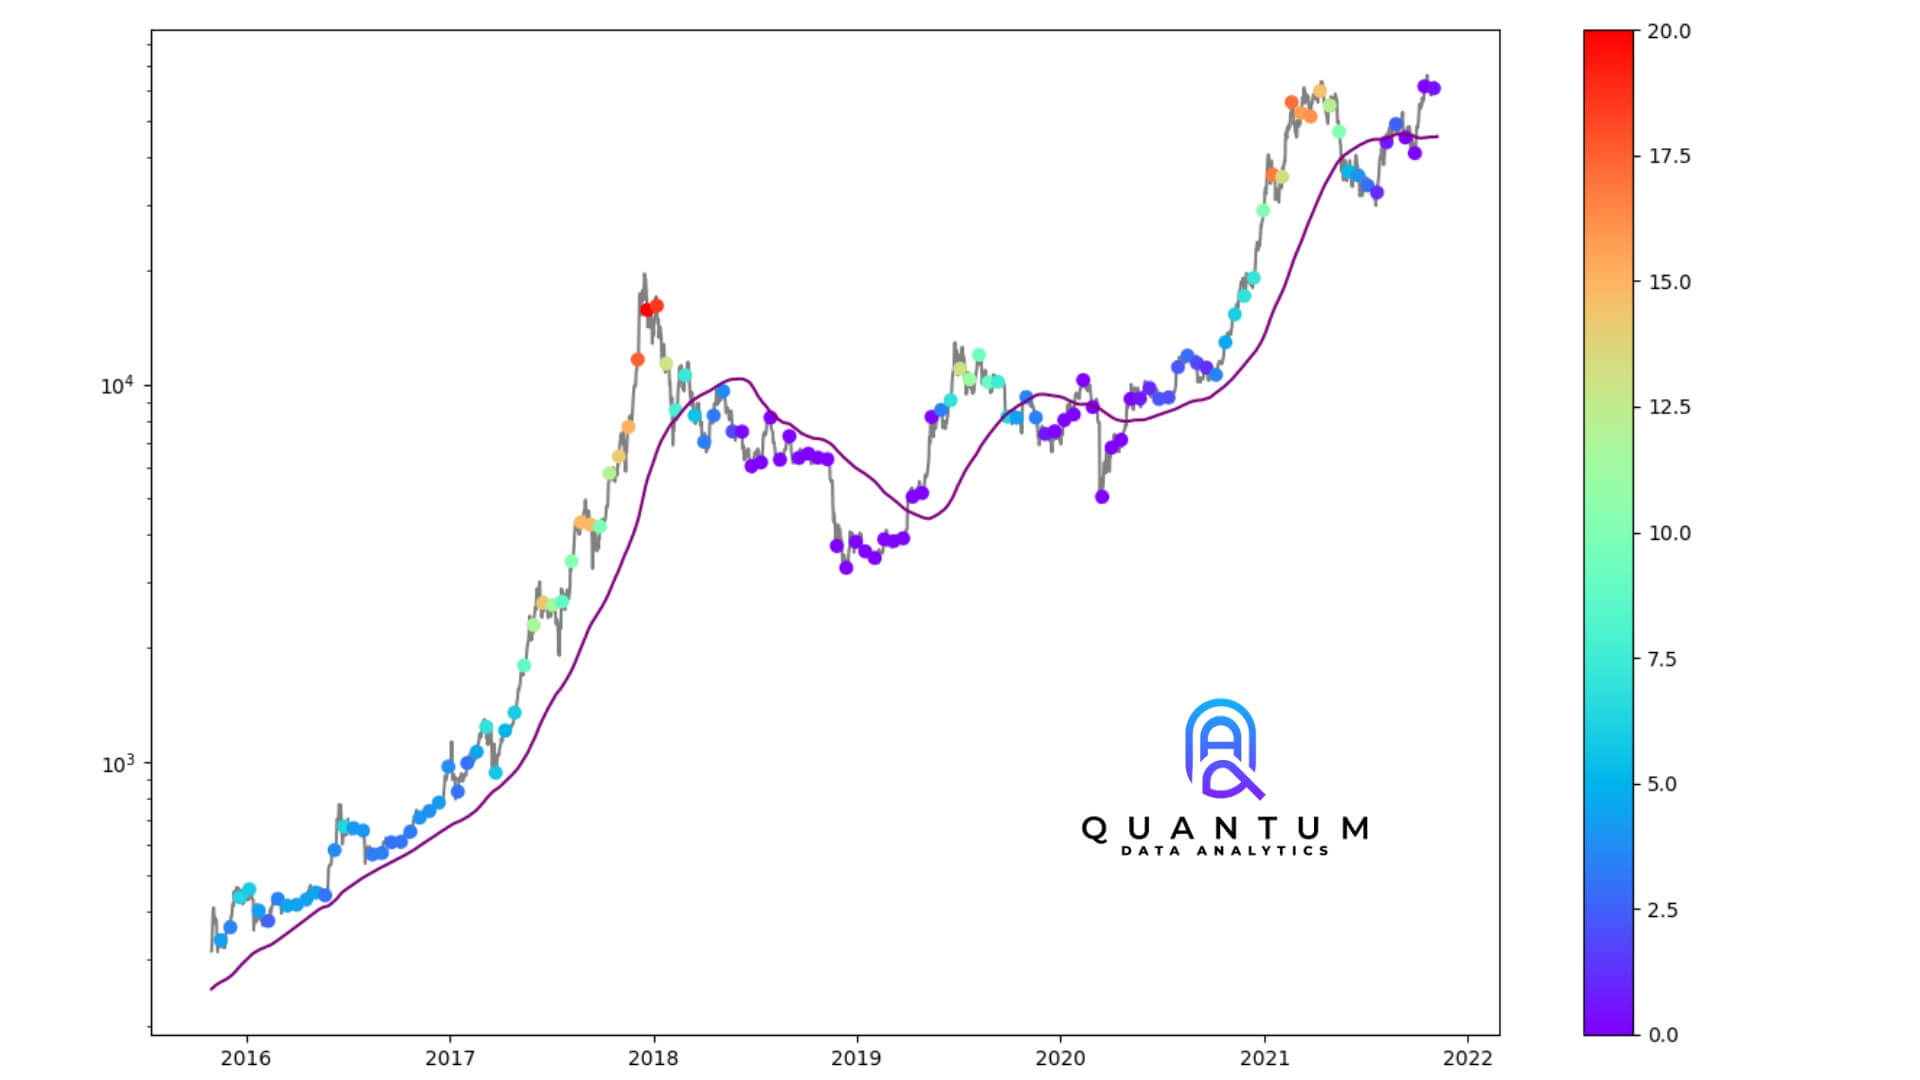
The main difference between traditional chart analysis and our regression analysis lies in the graphical representation. While traditional charts visualise price movements with so-called candlesticks, we present daily closing prices as dots, which are additionally differentiated by different colours. The colour changes signal that the market is beginning to change based on the indicators.
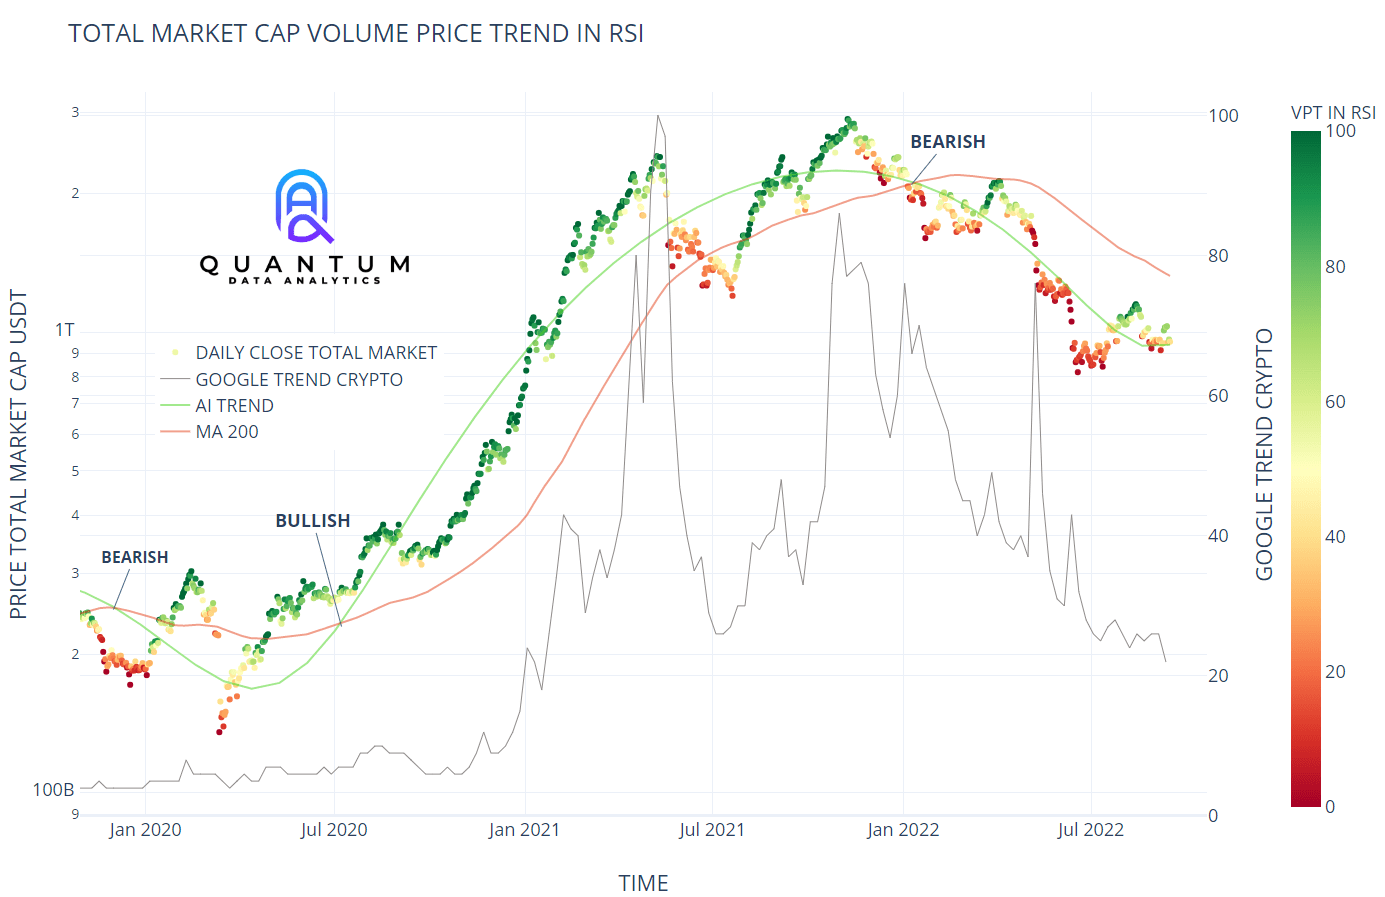

Advanced regression methods can provide robust results even when the data is affected by noise or unforeseen events.
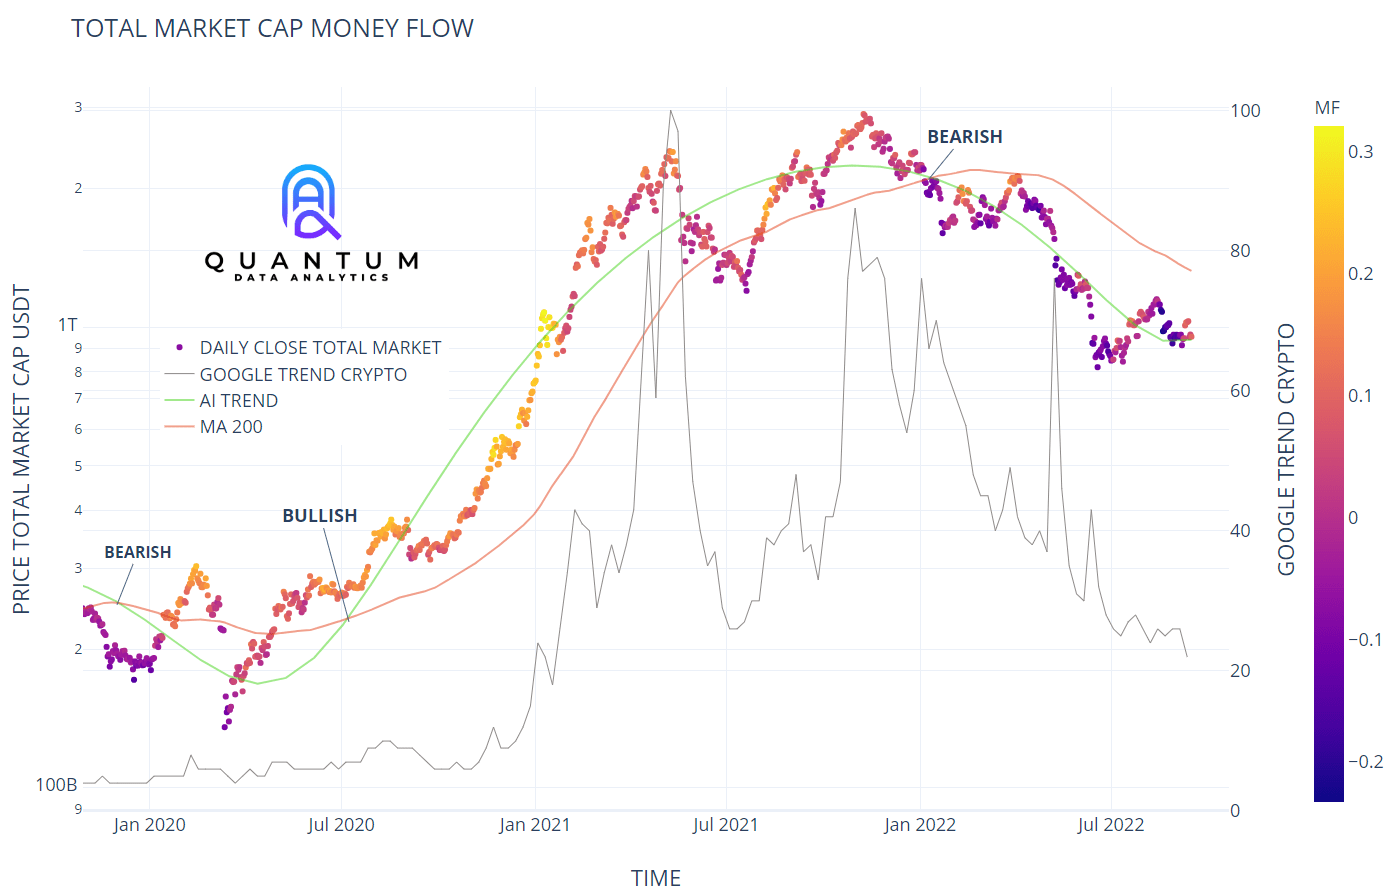
2
Price Zone
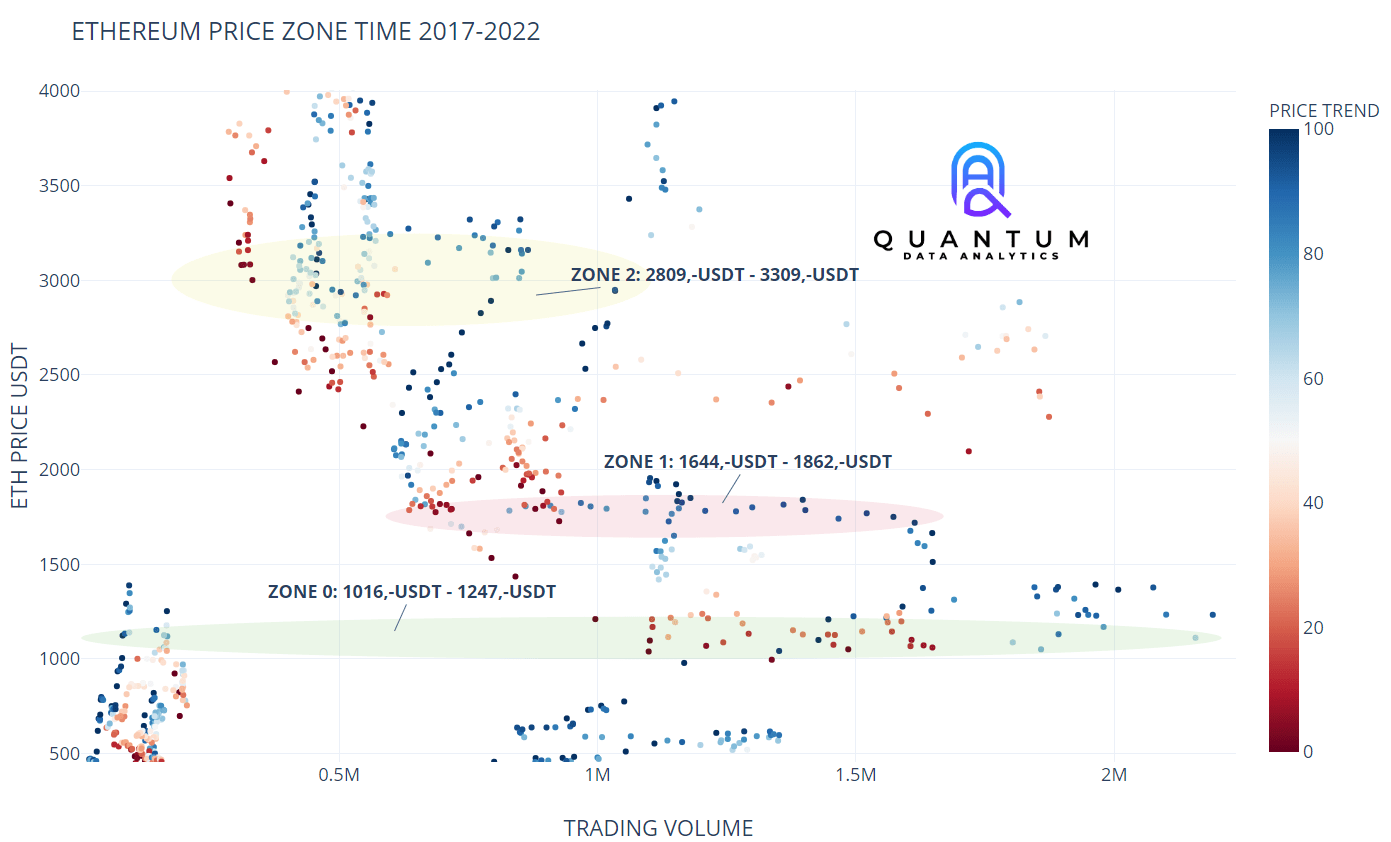
Price zones offer valuable insights into key support and resistance levels. These zones are identified through the analysis of price movements, trading volume, and time correlations. They are characterized by high trading activity, making them reliable indicators of where the majority of traders are experiencing profits or losses.
The color coding of price zones is based on various trend-following indicators that signal potential trend reversals. This visual representation enhances the clarity and usability of our chart analysis. The highlighted price zones are displayed as colored bars in our charts, improving both readability and user experience.